|
|
||||||||||||||
|
| ||||||||||||||
|
Tutorial
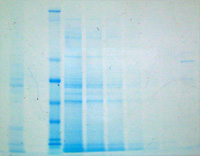
Protein band intensity/location analysis
This is an exemplary method that may generally work for any kind of image.
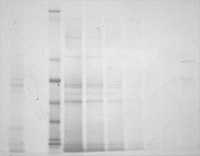
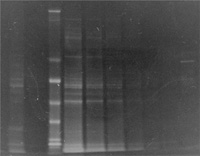
1. The original color image needs to be converted into inverted gray image
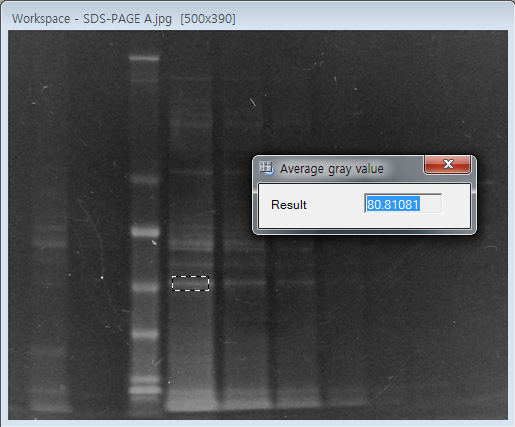
2. To calculate band intensity, analyze average gray value * Menu > Analysis > Average gray value
For accurate analysis, it may be necessary to consider background gray value if the image has gradient brightness.
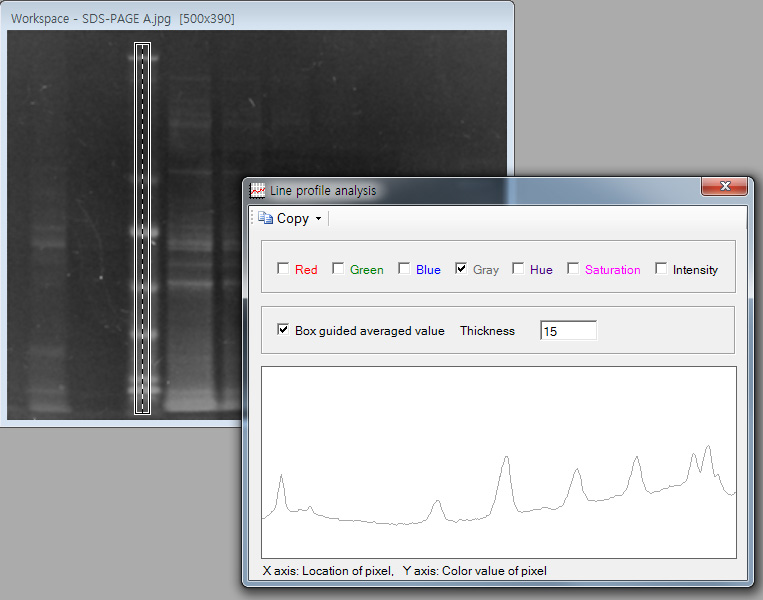
3. To identify band location, analyze line profile * Menu > Analysis > Line profile
4. Export tabulated data of the profile clicking on the 'Copy' button. Now, paste data to Excel (or other software) to analyze raw data of profile like the image shown in the below
|