|
|
|
|
| |
|
Tutorial
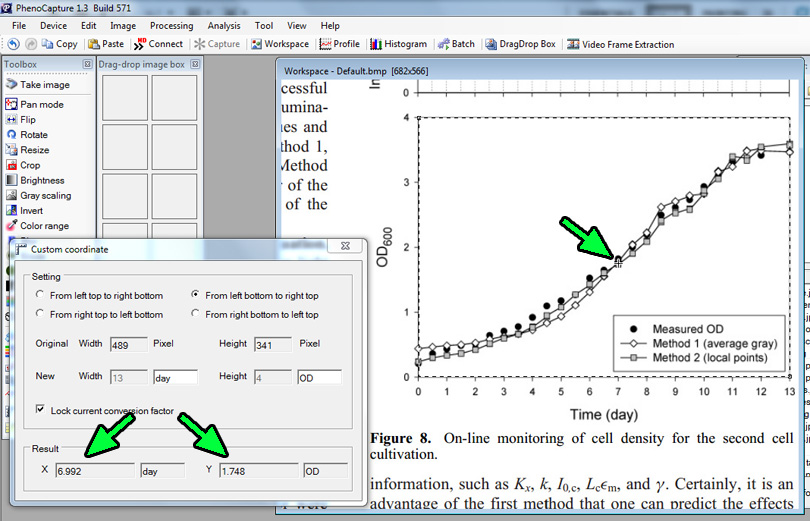
Custom coordinate
The purpose of the Custom coordinate is to extract data points or coordinates in a plot.
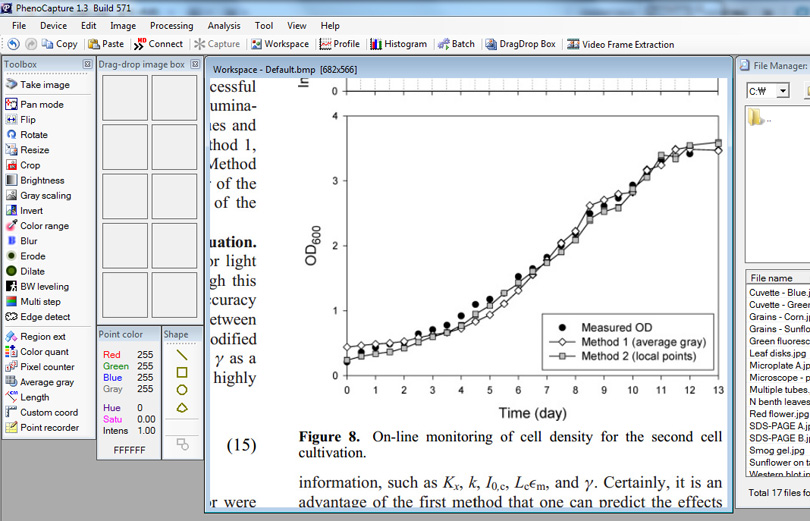
1. Load a sample image.
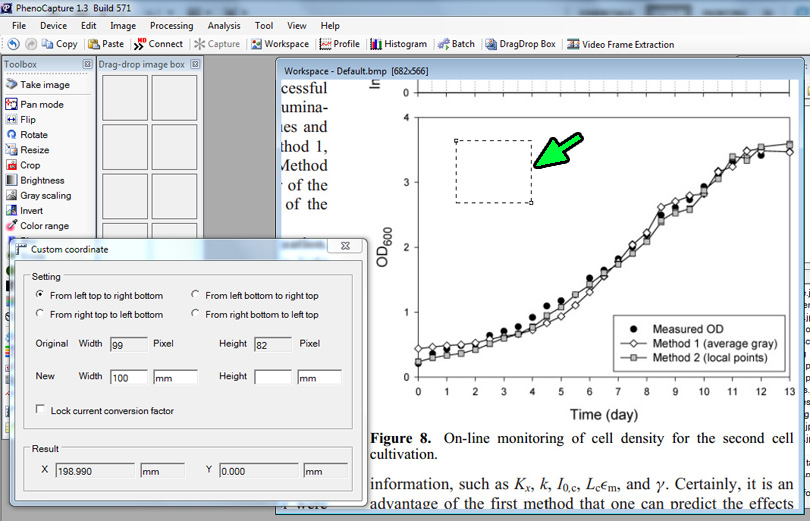
2. Click on the 'Custom Coordinate' in the main menu, 'Analysis'. You will see the 'Custom coordinate' window and a rectangle selection box.
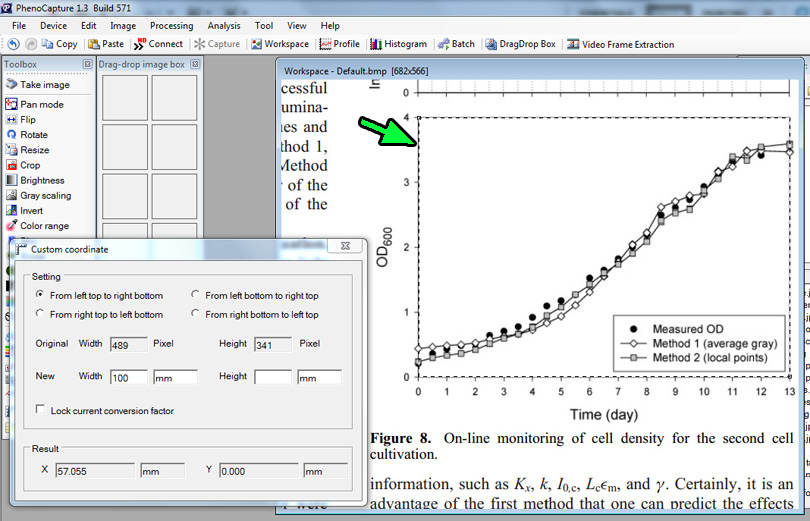
3. Adjust the selection box to cover the below the graph.
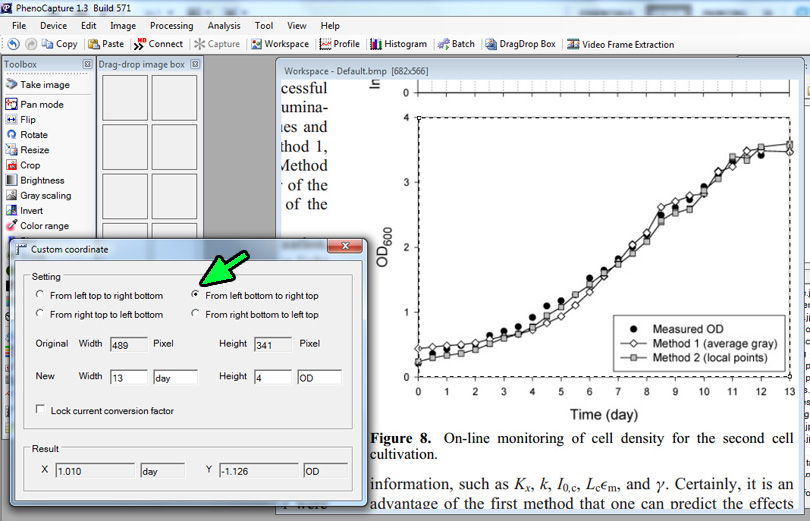
4. Because the zero points in the graph is located at the left bottom, click on the 'From left bottom to right top' in the 'Custom coordinate' window. Then, fill values in the 'Custom coordinate' window as shown below.
5. Locate mouse point in any location in the rectangle selection box. Then, read values in the 'Custom coordinate' window.
|