🎨 A Complete Guide to Object Color Analysis
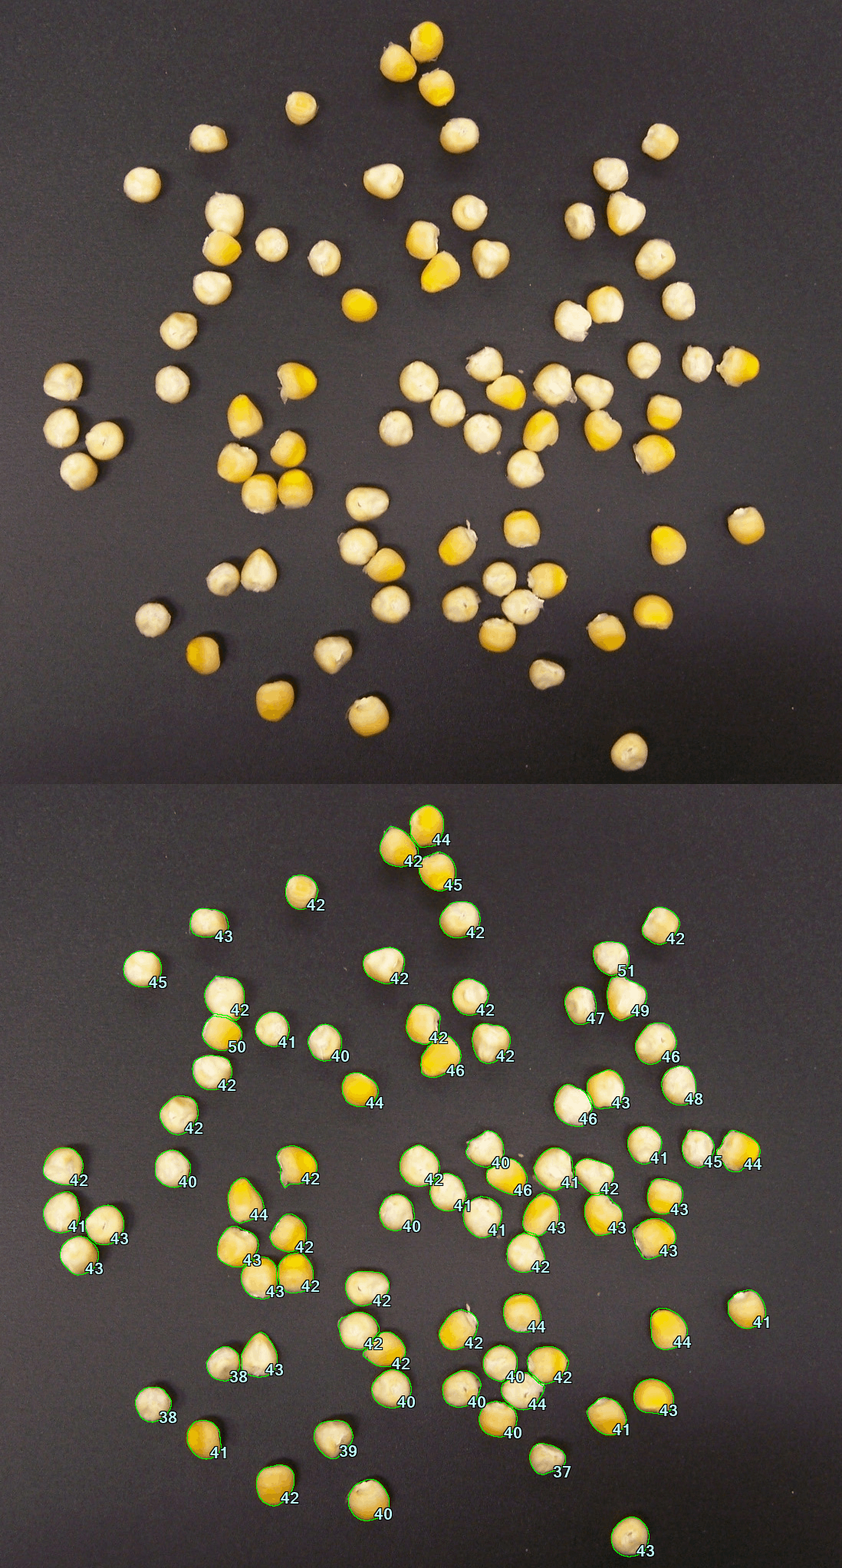
PhenoCapture AI’s Object Color Analysis is an advanced, automated tool designed to detect hundreds of individual objects in an image simultaneously and extract their highly precise color information. Whether you are analyzing the intensity of stained biological samples or examining the hues of industrial materials, this tool handles the heavy lifting by isolating each object and extracting accurate color data.
The tool offers immense flexibility, allowing you to use built-in binarization algorithms or import your own custom masks to perfectly define specific Regions of Interest (ROI) for color extraction.
💡 Key Features
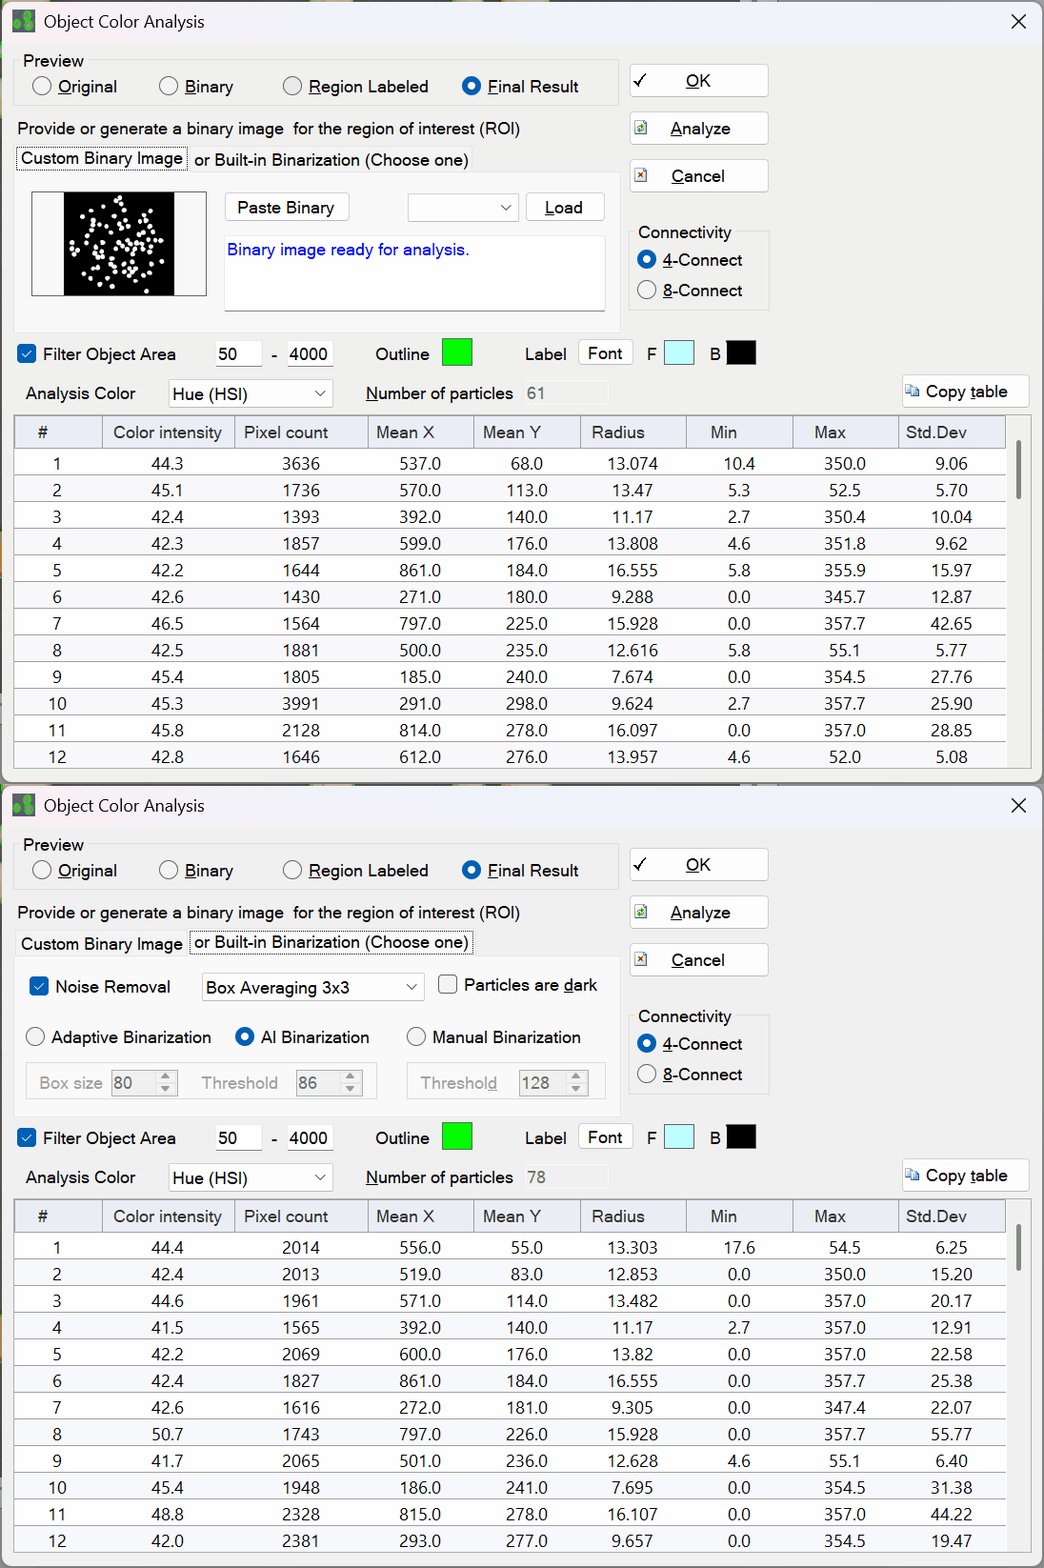
- Flexible Binarization Options: Choose between powerful built-in algorithms (Adaptive, AI, or Manual Binarization) or provide your own custom binary image (via clipboard paste or direct loading from image buffers) to define specific objects for color analysis.
- Advanced Pre-processing & Noise Removal: Clean up your images before analysis using Box Averaging or Gaussian Filters. You can also utilize the built-in noise removal tool to instantly eliminate small artifacts—targeting white noise, black noise, or both simultaneously in a single pass.
- Smart Object Filtering: A dedicated Filter Object Area checkbox allows you to easily toggle size screening on and off. Define Min/Max Size limits to ignore dust or merged blobs, ensuring you only extract color data from your actual targets.
- Comprehensive Color Extraction: Extract exact color data across multiple color spaces, including RGB (Red, Green, Blue), HSI, Lab, and CMYK, allowing you to quantify the exact shade, vibrancy, or intensity of any detected object.
- Customizable Visual Overlays: The software draws outlines and text labels directly on your image to indicate the measured color values. Easily change the Outline Color, Font Color, and Font Background to ensure labels are perfectly visible against any background.
- One-Click Data Export: All extracted data (including Object ID, Color Intensity, Pixel Count, and Mean coordinates) is organized into a sortable table. Click Copy table to paste everything directly into your spreadsheet!
🛠️ How to Use the Object Color Analysis Tool
Extracting detailed color data from hundreds of objects is incredibly easy. Follow these steps:
Step 1: Choose Your Binary Source
The interface is divided into tabs so you can define exactly how objects are detected:
- Custom Binary Image Tab: If you have already prepared a mask, you can paste it directly from your clipboard by clicking Paste Binary, or load it from a specific image buffer.
Note: Paste a binary image of the same size as the original. White areas on a black background represent the regions to be analyzed. If the pasted image is the wrong size or empty, a red error message will appear, and the analysis will be safely aborted to prevent errors. - Built-in Binarization Tab: Let PhenoCapture do the work. Enable Noise Removal, and select your binarization method (Adaptive, AI, or Manual). If your target objects are darker than the background, make sure Particles are dark is checked.
Step 2: Set Your Color Channel and Filters
Configure your analysis parameters to ensure accurate color extraction:
- Analysis Color: Select the specific color channel you want to measure (e.g., Red, Green, Blue, Hue, L-Lab, etc.) from the dropdown menu.
- Filter Object Area: Check this box to enable size filtering. Enter the Area boundaries (Min and Max) to screen out unwanted noise before color extraction. Uncheck the box to quickly measure the color of all detected objects regardless of their size.
Step 3: Analyze and Visualize
Click the Analyze button to process the image. You can easily review the software’s accuracy using the Show radio buttons located in the center of the window:
- Original: View the untouched source image.
- Binary: View the black-and-white mask used for object detection.
- Region Labeled: View the isolated objects with a distinct color flood fill.
- Final Result: View the original image overlaid with colored outlines and text labels displaying the measured color intensity.
Tip: Click the color boxes next to “Outline” or “Font” to customize the visualization colors to your liking!
Step 4: Export Your Data
Review the generated color metrics for every valid object in the data grid at the bottom of the window. When you are satisfied with the results, simply click the Copy table button. The data is instantly sent to your clipboard, ready to be pasted straight into your spreadsheet software for graphing and publication!
With the Object Color Analysis tool, transforming visual targets into precise, organized color data is completely effortless and highly customizable!