🎨 A Complete Guide to Color Quantification
PhenoCapture AI’s Color Quantification tool makes it incredibly easy to extract, count, and analyze the exact distribution of unique colors within your images. Whether you are analyzing pixel density, extracting specific hex codes, or exporting comprehensive color statistics for external research, this tool provides precise, real-time tabular data tailored to your selected regions.
Here is everything you need to know to start quantifying colors in your images.
💡 Key Features
- Precise Color Counting: Instantly calculate the absolute Total Colors (unique color codes) and total pixels present within your active image or selected boundary.
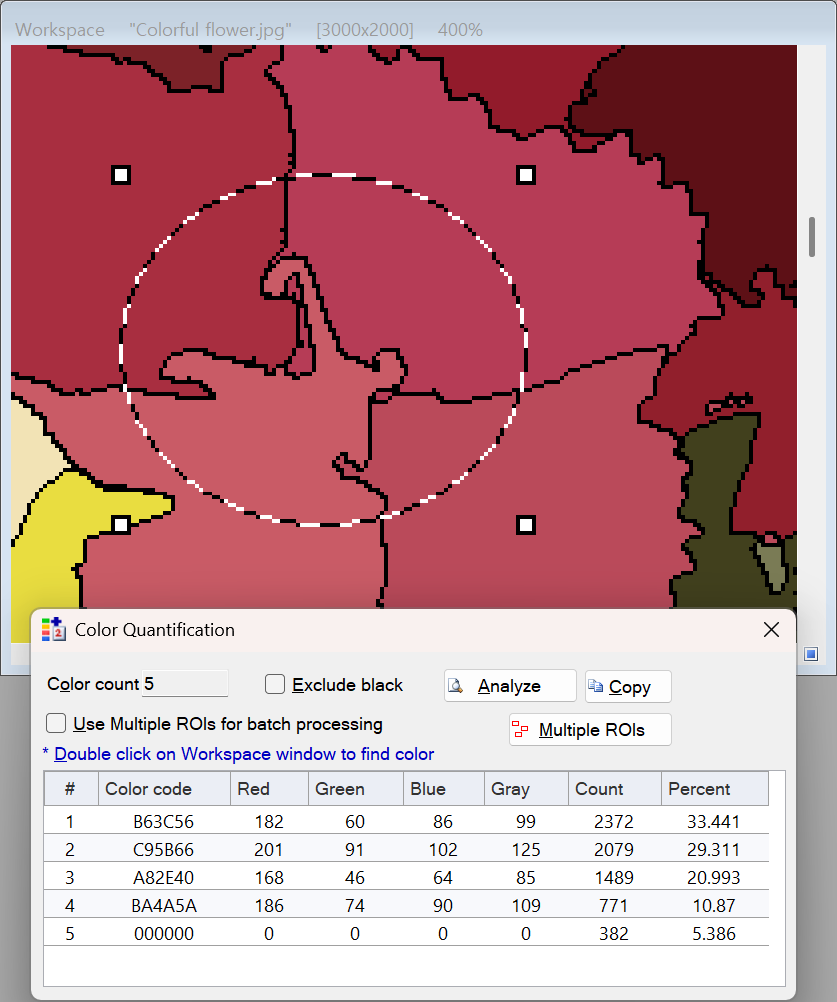
- Detailed Statistics Grid: Automatically breaks down every detected color into a comprehensive, easy-to-read table. Instantly view data points including Hex Code, individual Red, Green, Blue, and Gray values, absolute pixel count, and the percentage (%) of the total area each color occupies.
- Smart Background Exclusion: A convenient Exclude Black option allows you to automatically filter out pure black (
#000000) pixels from your data grid, which is perfect for ignoring empty backgrounds or masked-out areas. - Smart Regional Selection: Focus only on what matters. The tool seamlessly integrates with workspace selection tools and inverted masks to calculate statistics only within your targeted areas.
- One-Click Export & Multi-ROI: Need to move your data to Excel? A single click copies your entire statistics grid to your clipboard. You can also leverage the Multi-ROIs function to process and compare color counts across multiple distinct regions simultaneously.
🛠️ How to Use Color Quantification
Extracting detailed color statistics takes just a few simple steps:
Step 1: Define Your Analysis Area
On your main workspace, use your preferred selection or masking tool to highlight the exact area you wish to analyze. The tool automatically adapts to ignore unselected or masked regions, ensuring your pixel count and color data are perfectly accurate to your specific target.
Step 2: Generate Color Statistics
If the data does not populate immediately upon opening the tool, simply click the Analyze button. The software will instantly process the image and display the Total Colors count at the top of the window.
Step 3: Review the Data Grid
Look at the populated statistics table below to explore your color distribution. You can see the rank, exact visual Hex code, RGB breakdown, and how much of your selected area is dominated by that specific color (shown as a percentage).
(Note: If you are looking for a specific color code, the software can automatically find and highlight its row in the grid for you!)
Step 4: Refine Your Data (Optional)
If your selection includes unwanted black background pixels from a mask, simply check the Exclude Black box. The tool will instantly refresh the grid and remove any pure black entries, giving you a cleaner dataset for your target object.
Step 5: Export Your Results
Once your data looks perfect, click the Copy button. This will neatly package your entire data table (including all rows and columns) and copy it directly to your clipboard, ready to be pasted into Excel or your preferred data analysis software.
Step 6: Leverage Multi-ROIs (Optional)
When dealing with complex samples, you might need to count colors across several areas at once. Click the Multi-ROIs button to hand off your current settings to the main Multi-ROI processor, allowing for automated batch extraction of total color counts across multiple shapes or regions.
(Tip: Pressing the Escape (Esc) key at any time will quickly hide the Color Quantification tool, keeping your workspace clean and efficient!)