🧫 A Complete Guide to Multi-Cell Color Analysis
PhenoCapture AI’s Multi-Cell Color Analysis is a highly efficient tool designed for analyzing grid-based images, such as multi-well plates, microarrays, or any repeating patterns. Instead of measuring each region one by one, this tool automatically generates a customizable grid over your image and extracts data from dozens of individual cells simultaneously.
Here is everything you need to know to automate your grid-based image analysis.
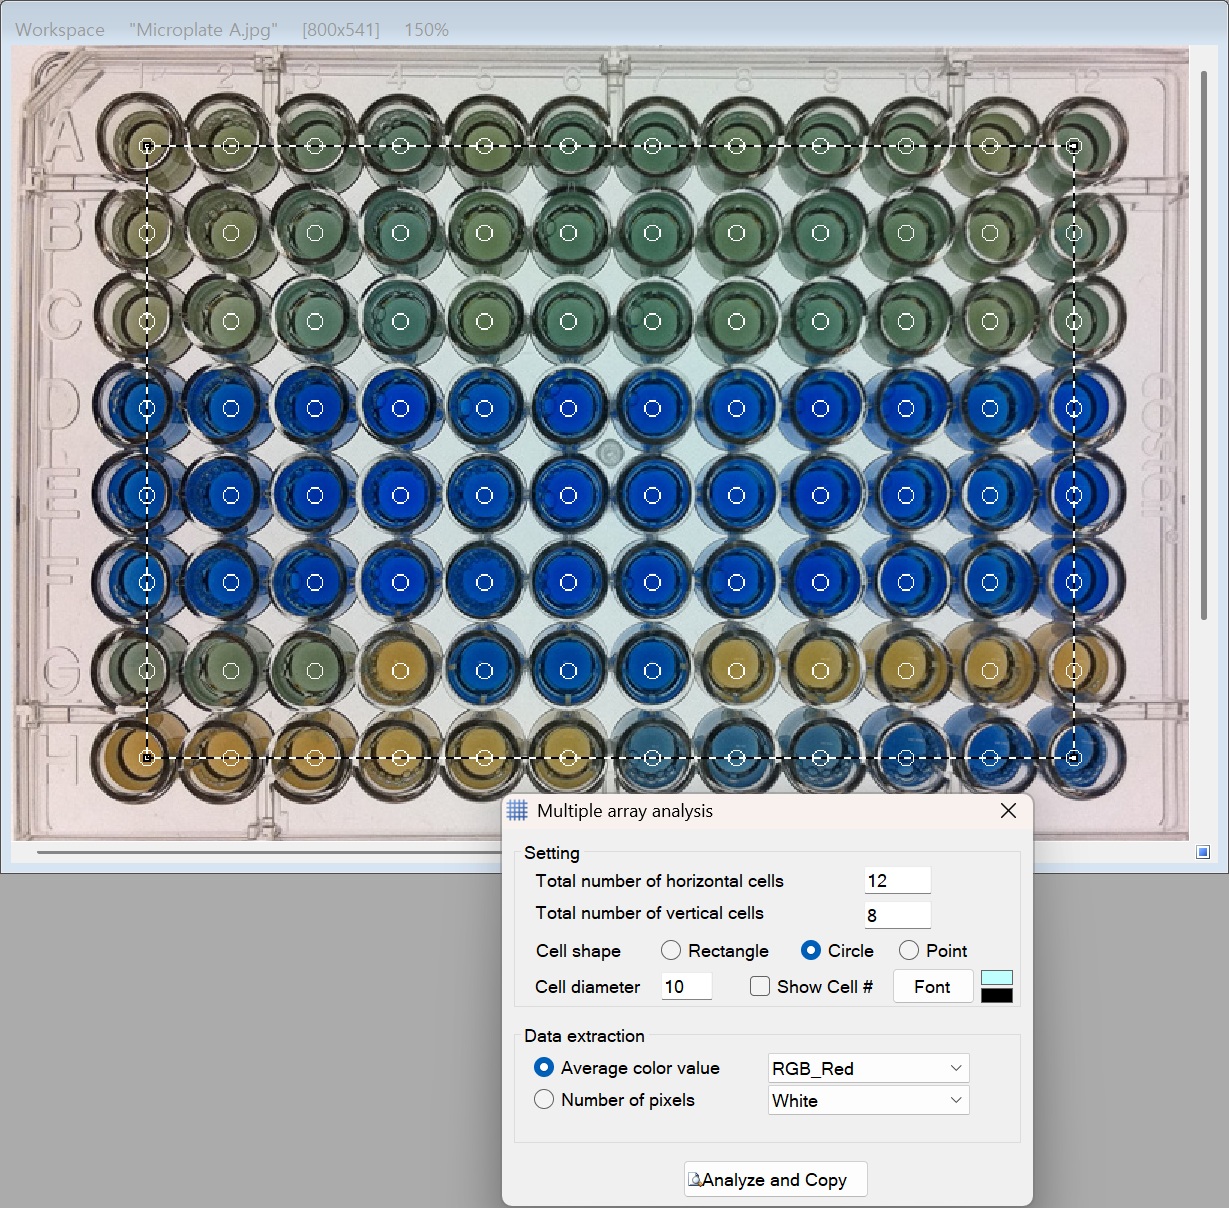
💡 Key Features
- Customizable Grids: Instantly generate a perfect grid by specifying the number of columns (X) and rows (Y). You can create anything from a simple 2×2 grid to a massive 50×50 array.
- Flexible Cell Shapes: Tailor the measurement area to fit your subject perfectly. Choose between Circles, Rectangles, or single Points, and adjust the exact diameter of the measurement cells.
- Dual Analysis Modes:
- Average Color Value: Calculates the mean brightness or intensity of the pixels inside each cell.
- Number of Pixels: Counts how many specific colored pixels exist within each cell.
- Visual Overlays: The software draws the grid directly on your live image, numbering each cell sequentially so you know exactly which data point corresponds to which cell.
- Instant Excel Export: Process your entire grid with a single click. The tool instantly copies the organized, tabulated data to your clipboard, ready to be pasted directly into Excel or any spreadsheet software.
🛠️ How to Use Multi-Cell Analysis
Extracting data from multiple regions at once is fast and intuitive. Follow these simple steps:
Step 1: Define the Analysis Area
When you open the Multi-Cell Analysis tool, the Rectangle selection tool is automatically activated. Click and drag on your main workspace to draw a large rectangle encompassing all the items (e.g., wells or colonies) you want to analyze.
Step 2: Configure Your Grid
In the tool panel, set up your grid layout:
- Cell X & Cell Y: Enter the number of columns (X) and rows (Y) to match your image.
- Shape: Choose whether the individual measurement areas should be Circles, Rectangles, or precise Points.
- Diameter: Adjust the diameter so the shape perfectly fits inside each well or target object without overlapping the borders.
(Tip: Keep the Show Cell Numb box checked so you can easily see the sequence numbers overlaid on your image!)
Step 3: Select Your Analysis Mode
Choose what kind of data you want to extract:
- Select Pixel Color to measure the average intensity.
- Select Number of Pixels if you want to count specific pixels, and pick your target color channel from the dropdown menu (e.g., Red, Green, Blue, Hue, etc.).
Step 4: Analyze and Export
Once your grid is perfectly aligned over your image, simply click the Analyze button. The software will instantly process every single cell in the grid and copy the organized results to your computer’s clipboard. Open Excel (or any spreadsheet software), hit Paste, and your data is ready for review!
With the Multi-Cell Analysis tool, turning complex grid images into organized, exportable data takes only seconds!