🧬 A Complete Guide to Region Extraction & Shape Analysis
PhenoCapture AI’s Region Extraction is a powerful analytical tool that automatically detects, isolates, and measures distinct objects or regions within your image. Please note that this analysis requires a binary image where the background is black and the target objects are white. The software works by first labeling these white objects and then analyzing their shape parameters. Whether you are analyzing cell clusters, sorting particles by size, or tracking coordinates of specific features, this tool identifies every unique region and extracts its exact mathematical and morphological properties instantly.
We offer several tools to perfectly isolate your objects before extraction. We highly recommend starting with Adaptive Binarization, as it is the most useful and versatile method for dynamically handling uneven lighting and shadows to get perfectly clean images every time. Click the links below to read the detailed manuals:
Here is everything you need to know about isolating and analyzing specific regions in your images.
💡 Key Features
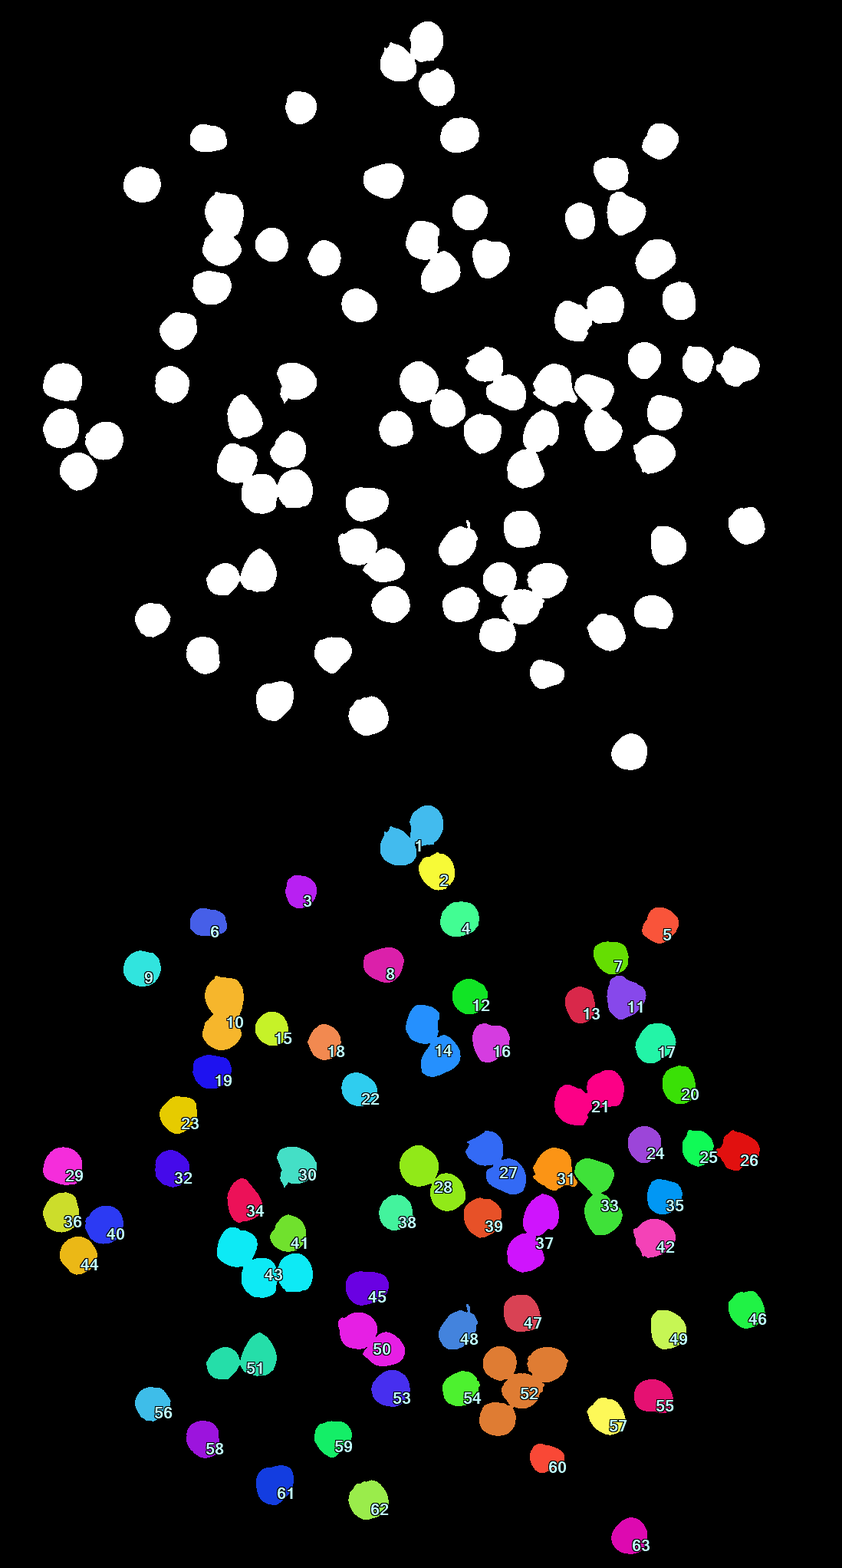
- Smart Auto-Labeling: The tool scans your binary image and automatically identifies individual, isolated white regions. It assigns a unique ID number and color to every single object, making it easy to distinguish hundreds of tiny particles at a glance.
- Precise Screening Conditions: Don’t let noise ruin your data! You can easily filter out dust or massive merged blobs by setting Min/Max Area and Min/Max Width/Height limits. Only the objects that match your exact criteria will be labeled and analyzed.
- Sorting & Top Limits: If you only care about the largest or smallest objects, you can automatically sort the results and limit the output (e.g., “Show me only the top 10 most circular regions”).
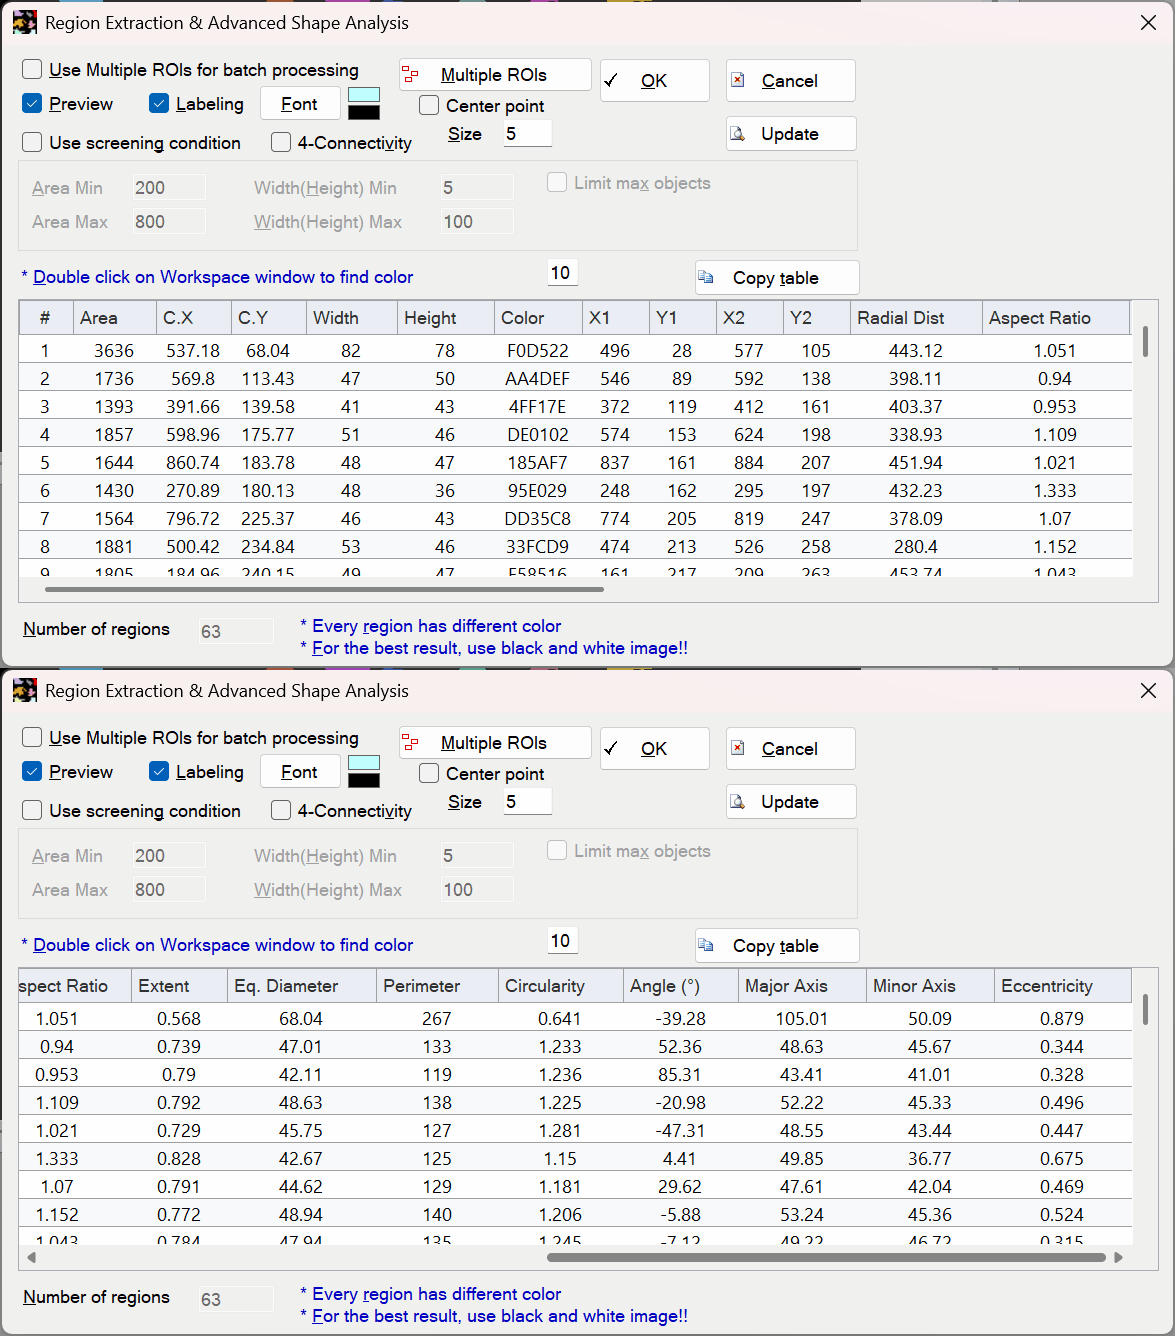
- Advanced Shape & Orientation Analysis: Go beyond basic bounding boxes! The software instantly calculates over 15 distinct properties, including spatial moments, perimeter, and advanced shape descriptors (like Circularity and Eccentricity) for every valid region.
- Instant Export: One click copies all your tabulated data directly to your clipboard (including column headers), perfectly formatted and ready to paste into Excel!
📊 Extracted Data Metrics (Glossary)
PhenoCapture AI extracts a comprehensive set of metrics for each identified region. Below is the complete list of parameters you can export and analyze:
| Category | Metric | Description & Formula |
|---|---|---|
| Basic Metrics | Area | The total number of pixels contained within the region. |
| Center X / Y | The exact centroid (center of mass) coordinates of the region. | |
| Radial Distance | The distance from the center of the entire image to the region’s centroid. | |
| Bounding Box | Width / Height | The dimensions of the smallest orthogonal bounding rectangle enclosing the region. |
| X1 / Y1 | The top-left coordinates of the bounding box. | |
| X2 / Y2 | The bottom-right coordinates of the bounding box. | |
| Shape & Density | Aspect Ratio | The ratio of the bounding box width to its height (Width / Height). Indicates how elongated the bounding box is. |
| Extent | The ratio of the region’s area to the area of its bounding box (Area / (Width × Height)). Measures how much the object fills its bounding box. | |
| Eq. Diameter | The diameter of a circle with the same area as the region. Useful for objectively comparing sizes of irregular shapes. | |
| Perimeter | The total number of pixels along the outer boundary (contour) of the region. | |
| Circularity | A measure of how closely the region resembles a perfect circle (4π × Area / Perimeter²). A value of 1 represents a perfect circle. Highly useful for filtering out overlapping cells or irregular artifacts. | |
| Moments & Orientation | Angle (°) | The orientation angle of the region’s major axis relative to the X-axis, calculated using 2nd-order spatial moments. |
| Major Axis | The length of the longest axis of an ellipse fitted to the region. Represents the true length of tilted objects. | |
| Minor Axis | The length of the shortest axis of an ellipse fitted to the region. | |
| Eccentricity | A measure of how elongated the fitted ellipse is, ranging from 0 (a perfect circle) to 1 (a line). |
🛠️ How to Use the Region Extraction Tool
Extracting precise data from your image takes just a few clicks. Follow these steps:
Step 1: Analyze the Image
First, ensure your active image is converted to a binary image (black background, white objects) using one of the methods linked above. When you open the Region Extraction tool, it will automatically process the image by labeling all the white objects. Look at the preview to see how the software has grouped the different regions.
Step 2: Apply Screening Filters
If there are too many unwanted objects (like tiny specks or huge background areas), check the Use Screening Condition box.
- Enter a Min Area and Max Area to ensure only objects of a specific size are analyzed.
- Enter Width/Height limits to filter out objects that are too long or too wide.
- Click Update to apply your filters. The preview and data table will instantly reflect your changes!
Step 3: Customize the Labels (Optional)
Make the visual data work for you:
- Check the Labeling box to overlay the unique ID number directly onto each object in the image.
- Check the Center Point box to draw a clean white dot at the exact mathematical center of every object.
Step 4: Export Your Data
Once your screening conditions are perfect and you see the exact regions you want to measure, click the Copy table button. All the precise metrics for your extracted regions will be copied and ready to be pasted straight into your spreadsheet or report!
With the Region Extraction tool, turning complex, cluttered images into beautifully organized scientific data is completely effortless!