📊 A Complete Guide to Average Color Value
PhenoCapture AI’s Average Color Value tool makes it incredibly easy to quantitatively analyze the color properties of your images. Whether you need to measure basic grayscale intensities, explore complex LAB color spaces, or extract specific data using custom formulas, this tool provides precise, real-time pixel data tailored to your selected regions.
Here is everything you need to know to start analyzing color values in your images.
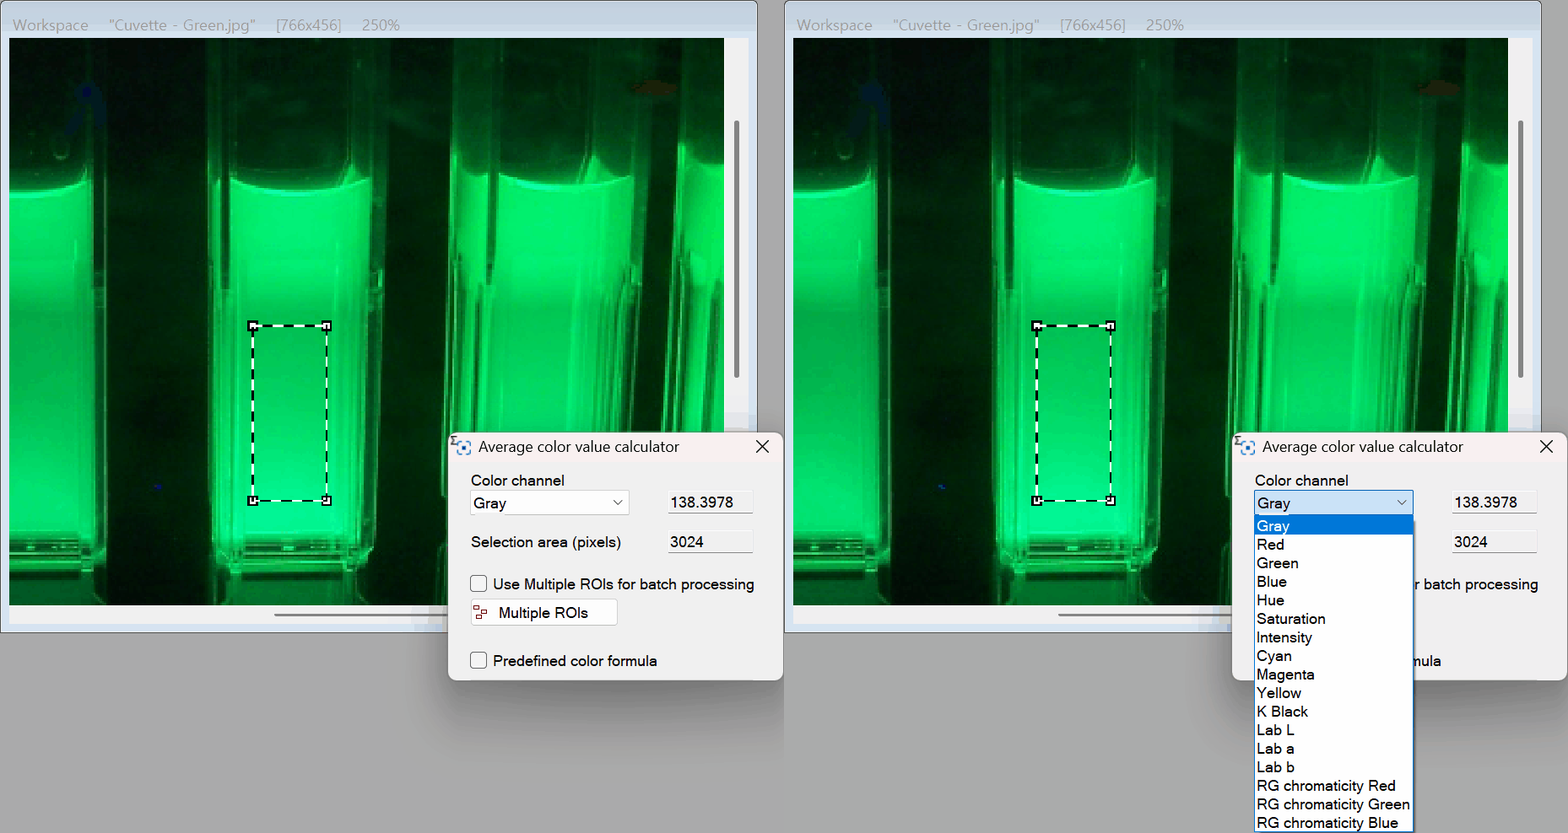
💡 Key Features
- Extensive Channel Support: Go beyond basic RGB. Easily analyze specific channels including HSV (Hue, Saturation, Intensity), CMYK, LAB (L, a, b), and RG Chromaticity directly from the dropdown menu.
- Dynamic Range Indicators: You never have to guess your data scale. The tool intelligently updates the expected value ranges (e.g., 0 ~ 255 for standard RGB, 0 ~ 360 for Hue, or -90 ~ 90 for LAB a/b) based on the specific channel you are currently analyzing.
- Custom Formula Analysis: Expand your analytical capabilities by activating predefined custom color formulas to extract highly specific visual metrics.
- Smart Regional Selection: Focus only on what matters. The tool seamlessly integrates with workspace selection tools (like masks and region boundaries) to calculate averages only within your targeted areas.
- Multi-ROI Processing: Need to analyze multiple areas at once? The built-in Multi-ROIs function allows you to calculate and compare average color values across several distinct regions of interest simultaneously.
🛠️ How to Use Average Color Value
Extracting average color data takes just a few simple steps:
Step 1: Choose Your Color Channel
Open the Average Color Value tool and use the main Channel dropdown menu to select the specific color space you want to analyze (e.g., Gray, Red, Hue, Lab L). Notice that the Range indicator text will automatically update to show you the minimum and maximum possible values for your selection.
Step 2: Define Your Analysis Area
On your main workspace, use your preferred selection or masking tool to highlight the area you wish to analyze. The tool automatically adapts to ignore unselected regions, ensuring your pixel count and average value are perfectly accurate to your specific target.
Step 3: Read the Results
Once your channel and region are set, the tool instantly processes the image. You will immediately see two key metrics:
- Total Pixels: The exact number of pixels analyzed within your selected boundary.
- Average Value: The precisely calculated average color value (displayed up to four decimal places) for your chosen channel.
Step 4: Apply Custom Formulas (Optional)
If your research requires specialized calculations, simply check the Show Custom Analysis box. This will seamlessly expand the tool’s interface. From here, you can select a specialized calculation from the Custom Formula dropdown to immediately generate a custom average value based on predefined algorithmic parameters.
Step 5: Leverage Multi-ROIs (Optional)
When dealing with complex samples, you might need to test several areas at once. Click the Multi-ROIs button to hand off your current channel settings to the main Multi-ROI processor, allowing for batch extraction and comparison of average values across multiple shapes or regions.
(Tip: Pressing the Escape (Esc) key at any time will quickly hide the Average Color Value tool, keeping your workspace clean and efficient!)