✨ A Complete Guide to Hough Transform (Lines)
PhenoCapture AI’s Hough Transform for Lines is a highly advanced computer vision tool designed to detect straight lines within an image. By mathematically converting spatial edge pixels into a parameter space (known as the Hough Space or Sinogram), this tool allows you to identify geometric lines even if they are broken, dotted, or partially obscured by noise. The output is a highly precise accumulator image where the brightest spots represent the strongest straight lines in your original image.
Please note that this tool automatically performs a high-speed internal binarization (thresholding bright pixels >= 128), meaning you can apply it directly to both color and binary images! (Looking to detect circular shapes instead? Check out our Complete Guide to Hough Circle Detection!)
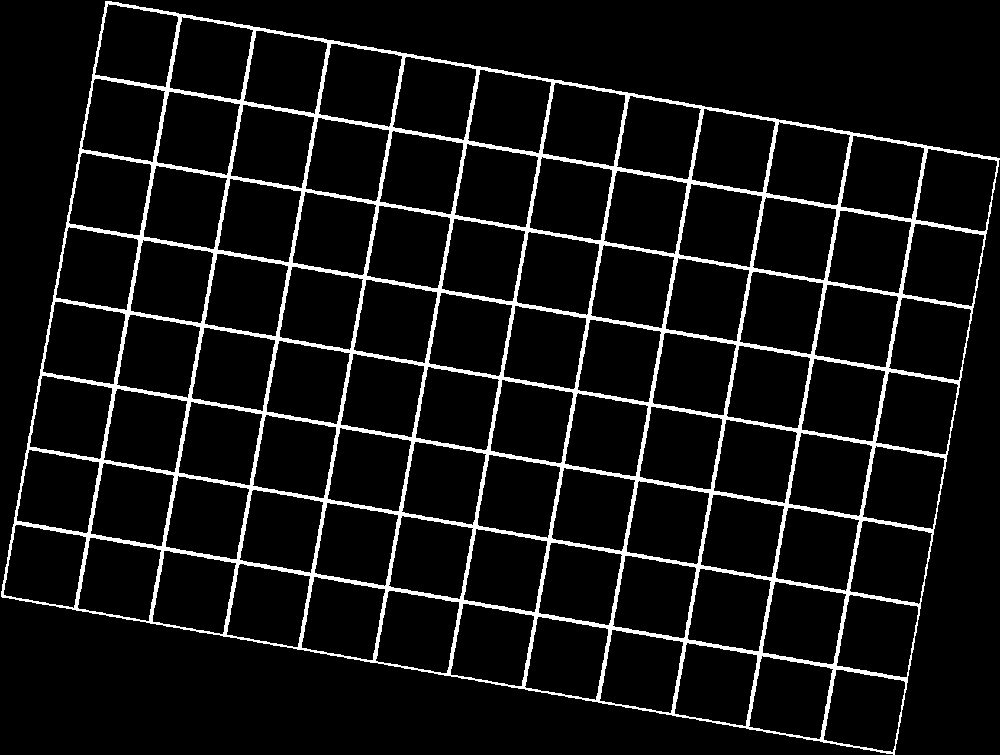
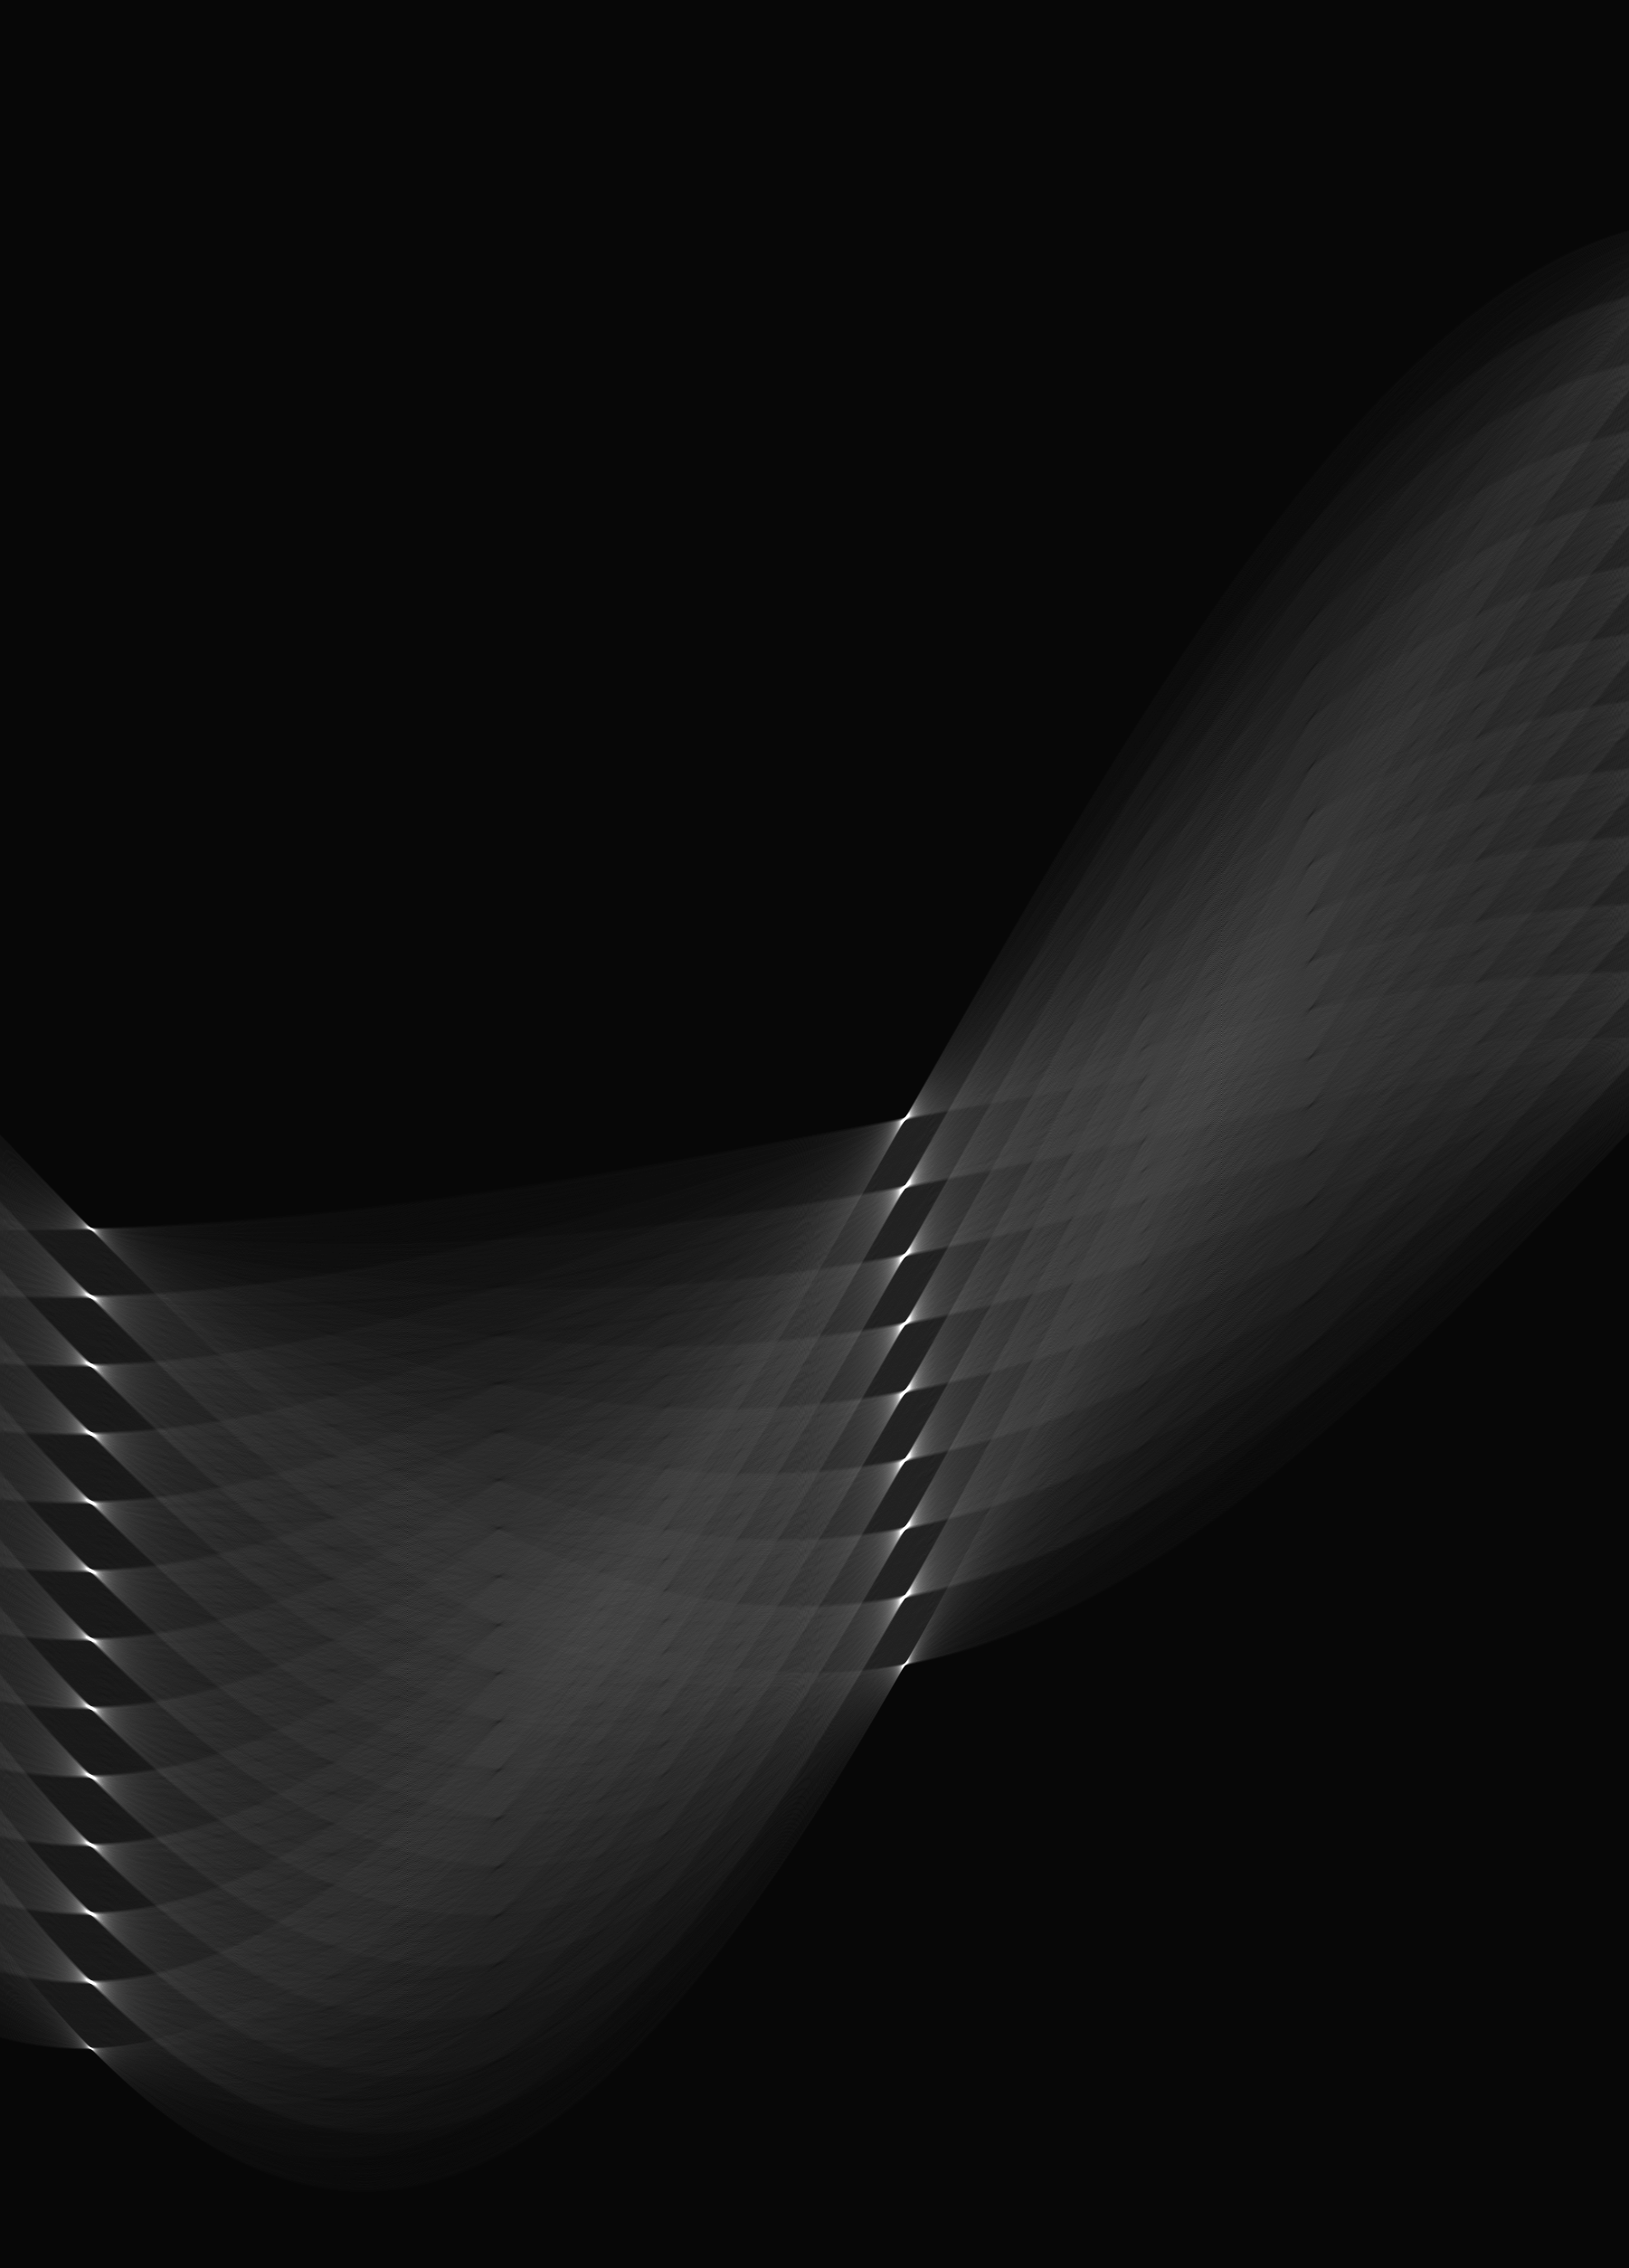
💡 Key Features
- High-Precision Angular Resolution (0.1° Steps): The algorithm calculates line angles from
0°to180°using an incredibly fine step size of 0.1 degrees (generating1,801discrete angular columns). This guarantees sub-degree accuracy when detecting the exact slope and trajectory of your lines. - Automatic Binarization & Point Extraction: The tool automatically binarizes your image internally by identifying bright foreground pixels (intensity
>= 128). It extracts only the relevant outline coordinates and completely ignores the empty dark background, drastically reducing the calculation workload. - Multi-Core Parallel Voting & LUT Acceleration: Sine and cosine values are pre-computed into high-speed Look-Up Tables (LUTs), and the core “voting” process—mapping spatial coordinates to the
(r, θ)accumulator space—is distributed across your CPU cores in parallel. - Flexible Normalization (Relative & Absolute): The accumulator results are automatically normalized to a standard
0–255grayscale range using either relative scaling (255.0 / maxAccu) or absolute threshold scoring (255.0 / (UserMaxCount + 1)), ensuring dominant lines shine as sharp white peaks. - Smart Regional Masking (ROI Support): Want to detect lines in just one specific portion of your image? Draw a selection boundary! The tool will safely restrict its outline extraction and coordinate voting strictly to your masked area.
- Seamless Undo Integration: Connected directly to PhenoCapture AI’s built-in undo engine, allowing you to quickly test line detection and revert back to your original spatial image with a single click.
📐 How the Line Hough Transform Works (Background & Principles)
To get the most out of the Hough Transform, it helps to understand why it uses polar coordinates instead of standard schoolbook algebra:
- 1. Why Polar Coordinates
(r, θ)Instead ofy = mx + b? In standard Cartesian geometry, a straight line is written asy = mx + b. However, when a line approaches vertical (90°), its slopemapproaches infinity (∞), making computer calculations impossible. To solve this, the Hough Transform uses the Hesse Normal Form:r = x · cos(θ) + y · sin(θ)Here,
ris the perpendicular distance from the top-left origin(0, 0)of your image to the line, andθ(theta) is the angle of that perpendicular vector against the X-axis. Every possible line in an image can be represented cleanly with finite numbers! - 2. Point-to-Sinusoid Duality (Why You See Waves):
- A single bright pixel
(x, y)in your original image has an infinite number of possible straight lines passing through it at different anglesθfrom0°to180°. When plotted in Hough Space, all those possible lines trace out a smooth sinusoidal wave (sine curve). - When dozens or hundreds of pixels lie along the same straight line in your image, each pixel generates its own sinusoidal wave in Hough Space—and all of those waves intersect at the exact same point
(θ, r)! - Every intersection accumulates a massive number of “votes,” creating a bright white star-like peak (sometimes called a “butterfly” peak) at the exact
(θ, r)coordinates of that line.
- A single bright pixel
🧭 Understanding the Generated Image: X-Axis, Y-Axis & How to Interpret It
The image generated by PhenoCapture AI is a 2D map of the Hough Accumulator Array with dimensions of 1801 pixels wide by (2 × Rmax + 1) pixels high:
1. What the X-Axis Means (Angle θ)
- Range: The X-axis spans from
0°(far left,X = 0) to180.0°(far right,X = 1800) in increments of0.1°per pixel. - How to convert X-pixel to Angle: Simply multiply the X-coordinate by
0.1(i.e.,θ = X × 0.1°).X = 0(θ = 0°) orX = 1800(θ = 180°): The normal vector is horizontal, which means the line in your original image is a perfectly vertical line!X = 450(θ = 45°) orX = 1350(θ = 135°): Corresponds to 45° diagonal lines in your original image.X = 900(θ = 90°, exact horizontal center): The normal vector is vertical, which means the line in your original image is a perfectly horizontal line!
2. What the Y-Axis Means (Perpendicular Distance r)
- Range: Because
r = x · cos(θ) + y · sin(θ)can yield negative values whenθ > 90°, the maximum possible distance is the diagonal length of your original image:Rmax = √(Width2 + Height2). To display both positive and negative distances, the Y-axis spans from-Rmax(top) to+Rmax(bottom), with a total height of2 × Rmax + 1pixels. - Center Line (
Y = Rmax): The exact vertical middle of the Hough image representsr = 0—meaning a line that passes directly through (or very close to) the top-left origin(0, 0)of your source image. - Above Center (
Y < Rmax, Negativer) & Below Center (Y > Rmax, Positiver): The further a bright peak is from the vertical centerY = Rmax, the further that line is located away from the top-left corner of your original image. Exact distance in pixels is calculated as:r = Y - Rmax.
3. Quick Visual Guide to Interpreting Patterns in Hough Space
- Bright Isolated Peaks (Butterflies): Each bright white intersection represents one dominant straight line. The brighter the peak, the more pixels (or the longer the segment) belong to that line.
- Multiple Peaks Stacked Vertically (Same X-coordinate, Different Y-coordinates): Because these peaks share the exact same angle
θ(same X position) but have different distancesr(different Y positions), they represent parallel lines (such as grid lines, striped patterns, or parallel edges) in your original image! - Peaks Separated by 900 Pixels Horizontally (
Δθ = 90°): If you see one set of peaks atX1and another set of peaks shifted horizontally by900pixels (e.g., atX = 0andX = 900, orX = 300andX = 1200), your original image contains perpendicular (90° intersecting) lines, such as a rectangular box or a checkerboard grid!
🛠️ How to Use the Hough Transform Tool
(Tip: While the tool automatically binarizes your color images, the Hough Transform algorithm is mathematically designed to work best on thin binary outlines or edge maps. For the absolute best results, use an edge detection or outline filter on your image before running this tool!)
Step 1: Prepare Your Image and Mask (Optional)
Ensure your image is loaded into the main workspace. Because the tool automatically runs an internal binarization algorithm, you can use either a color image or a pre-processed binary edge map. However, for the sharpest and most accurate line peaks, we highly recommend isolating your edges beforehand using our dedicated high-performance binarization tools: Manual Binarization, Adaptive Binarization, Binarization and Segmentation, or Custom Binarization.
If you only want to detect lines within a specific region (like a specific grid or boundary), use the advanced selection tools to draw your mask.
Step 2: Apply the Tool
Navigate to the menu and click on Hough Transform (Lines).
Step 3: Analyze the Hough Space Output
The software will rapidly extract the outline coordinates, execute the parallel trigonometric voting process across all 1,801 angular steps, and generate a new accumulator image:
- The X-axis represents the normal angle
θ(from0°to180°, whereAngle = X × 0.1°). - The Y-axis represents the shifted perpendicular distance from the top-left origin (
r = Y - Rmax). - The brightest intersections (peaks) correspond directly to the longest and most prominent straight lines in your original image!
If you need to return to your original image, simply use the standard Undo shortcut.